
Creates walking routes based on user reports
Project Overview
01.
Research & Insights
Interviews
02.
Ideation & Validation
The solution
Sketches
Guerilla usability testing: First Round + Second Round
03.
Product Requirements Document
Full Product Requirements Document
04.
Final Design
Screen shots
Figma Prototype
Research & Insights
Interviews
As part of a UX study assignment we conducted a face to face qualitative interviews with 3 pedestrians to identify challenges they face. Some of the problems that came up were accessibility problems, blockages and bad weather.
The questionnaire was semi-structured with 21 questions
Examples
-
While walking, do you use any tool to get around? If so, why him?
-
What annoys you the most about walking?
-
Do you use any app or maps for navigation? And if so, by which?
-
What would you change in the way you arrive? why? how?
"When I can pass, I pass. The road sign has no meaning"
"
"The sprinklers turn too much and they splash on the path, you have to get wet to get home."
"
"In my practical training, I met people with both a rhetorical disability and a cognitive disability, and they share the difficulty of getting around."
"
This led us to focus our application on finding a solution to the obstacles that stand in the way of pedestrians, including poor infrastructure such as blockages, density and the conditions of the paths.
So we wanted to explore:
How can we inform people and help them avoid obstacles on the way?

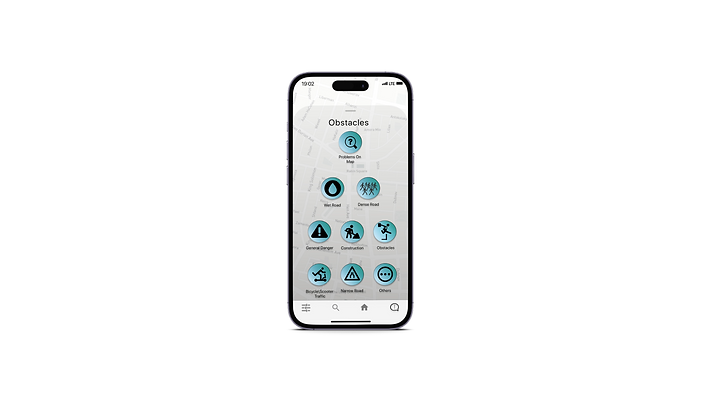
Users can search for an exact address they want to navigate to

Users can view the walking route built for them on the map, combined with warnings about obstacles on their route and nearby

Users can view the details of the obstacle on the map, report if it is not there, mark if they liked the report by clicking the heart and add a comment regarding the report
Ideation & Validation
The solution
Once we had defined the problem, we looked for a suitable solution based on the information we learned from the interviews we conducted at the beginning of the project.
Therefore we generated multiple tabs containing potential solutions.
Ultimately, we decided to focus on the idea of establishing an app that would be a collaborative network for pedestrians.
This network's primary objective is to create the safest and most efficient walking routes for pedestrians, all achieved through regular user-generated reports.


Sketches


Guerilla user testing: First Round
Process
We performed Guerilla usability testing with 5 subjects, using Figma's prototype, and asked the subjects to perform several actions:
1. Sign up for the app.
2. Enter the address Bilu 12 street Tel Aviv in the search, and navigate to it.
3. Look for alternative routes.
4. During the walk you come across a wet road, report the hazard.
5. Sign out from the application.


Conclusions
1
Alternative Routes Location
Throughout the tests, all the subjects had difficulty finding the button that displays alternative routes, and some did not recognize it even when they reached it. From this we came to the conclusion that not only is the button in a hidden place, its purpose is not understood by the users.


Before:
In the navigation page, clicking on the instructions at the top will lead to finding the more routes button. By clicking this button, the user can view more routs options


After:
In the navigation page, opening the bottom tab will reveal the More Routes button. By clicking this button, the user can view more routs options
2
The Wet Road Report Button
Some of the subjects were not able to recognize the wet road report button, so we decided to change it as well to a clearer icon.

Before:
After:
*The color palette changed during the project regardless, the relevant change made following the tests is in the icon of the wet road
3
The Logout Button
The logout process was clear to most participants, but we identified a problem with the size of this button, so we enlarged it.


Before:
After:
Guerilla user testing: Second Round
Process
After the first round of tests and the implementation of the conclusions, we added 2 new questions to the existing questions:
1. There is a report about density on the map, mark that you liked the report.
2. Stop navigation.
Conclusions
An improvement from the previous tests
In the second round of tests that was conducted, we saw that the improvement made to the Alternative Routes Button worked, and all the subjects found it easily.
The same improvement also applies to the other tasks in which the subjects then had difficulty in the first round.
The Density Report Button
Two of the subjects had difficulty finding the density button on the map, but after finding it, they liked it quite easily.
1
Before:
After:
2


